
Get a first impression, scheduled soon.
Request a demo to see how NIPO can help you meet your requirements with our smart survey solutions.
In one of the previous “scripting problem of the month” sessions we looked at how surveys end. In this NIPO Academy we will look at how surveys start. How you maximize the number of real respondents and keep bots out.
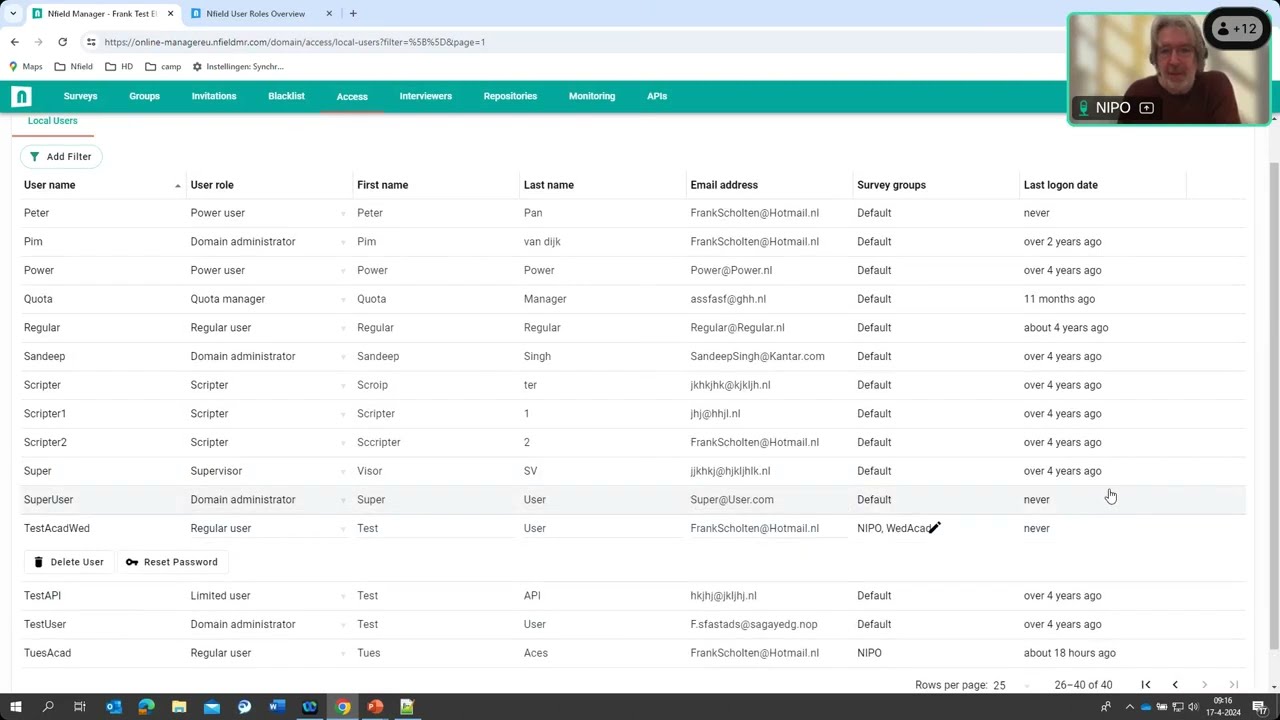
Already for some time you can limit the access to different surveys to one or more groups of users on your Nfield domain. But until recently the configuration of this feature was only possible through the API. Now that the configuration is available through the Nfield Manager as well, it is time for a proper introduction of the survey access options.
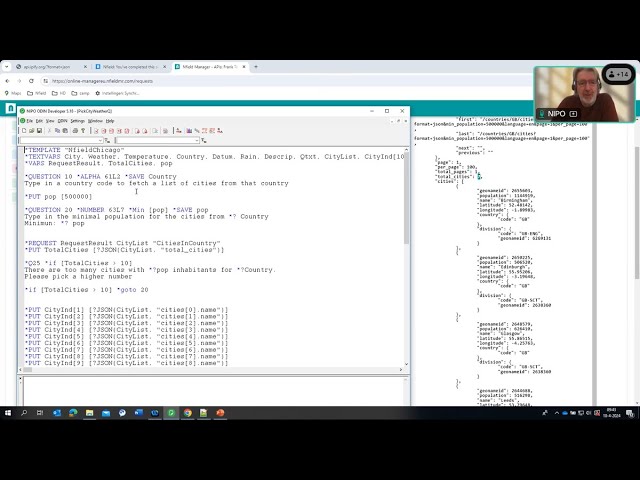
The new feature, the *REQUEST command, is an extension and replacement of the GETDATA command and meant to connect with external API’s. For instance, to connect with a database.
Most online market research surveys begin with an email invitation to participate. If these emails don’t reach their intended recipients and attract their attention, your survey is going to suffer. Successful delivery, which means landing in each recipient’s inbox, not their spam folder, is never guaranteed. And being recognized by them as a legitimate message, which should be opened, is essential to avoid being clicked straight into the trash.
It may sound a bit like a game of chance, but you can take steps to tip the odds firmly in your favor.
To protect ordinary people from being bombarded with huge amounts of unsolicited and undesirable emails which flood the internet every day, email service providers and email apps implement a range of checks on each item before allowing it to reach an inbox. The best practices outlined in this article will help your emails to pass these checks.
The domain your survey invitation emails come from matters. Recipients are more likely to open emails sent from a domain they recognize and feel they can trust. Nfield can easily be configured to send from custom domains as necessary. (Of course, you need to send from a domain you are legitimately entitled to use and have the credentials for – you can’t just borrow any domain you feel like using!)
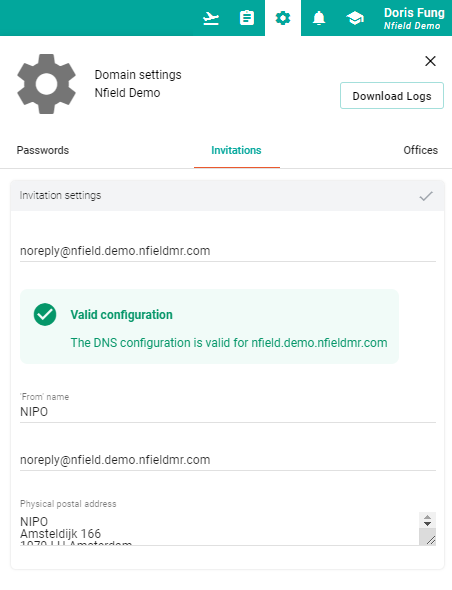
To ensure each custom domain passes relevant delivery checks, you should set up email authentication protocols such as DMARC (Domain-based Message Authentication, Reporting, and Conformance), DKIM (DomainKeys Identified Mail), and SPF (Sender Policy Framework). This is something for your email administrator to take care of.
These protocols authenticate emails to confirm they are legitimately being sent from the domain they appear to be from, effectively removing one of the reasons that emails get flagged as spam.
Once these protocols have been set for a custom email domain, please contact our support to connect this domain to Nfield.
Obtaining consent to email the people you want to invite to your online survey is important for various reasons. For a start, your emails won’t come as a surprise, so they’re less likely to be suspicious and bin them without opening, or report them as spam. Either of these actions will be unhelpful to both your survey response rate and your domain reputation.
Aside from this, obtaining recipient consent to include them in a distribution list is both a best practice and a legal requirement under the General Data Protection Regulation (GDPR). Compliance with GDPR demonstrates your commitment to respecting individuals’ privacy rights and strengthens trust between your organization and the survey respondents you rely upon. By securing explicit consent, you not only uphold ethical standards but also mitigate the risk of non-compliance penalties. Prioritizing consent as part of your email outreach strategy aligns with GDPR’s principles of transparency and accountability, which fosters a positive relationship with your audience.
Read more about EU GDPR specifications.
Sending survey invitation emails to addresses that don’t exist results in hard bounces that reduce your delivery rate and damage your email reputation. Even when you think you’ve done everything right, invalid addresses can still get into your system through people accidentally mistyping or deliberately providing false information.
You can flush out bad email addresses by using validation tools (such as Emailable or ListWise). Maintaining a clean and validated distribution list will return higher delivery rates and keep your reputation intact.
Even if recipients have consented to being on your distribution list, they have the right to change their minds. It is important that every email contains an unsubscribe link through which recipients can easily manage their preferences. Any requests to opt-out need to be honored promptly to avoid reputational damage caused by unwilling recipients failing to open emails, and possibly reporting them as spam. If you continue to contact people who’ve opted out, they will also develop negative feelings towards the brand being represented.
Enabling easy opt-out demonstrates respect for recipients’ choices and helps preserve your email sender reputation. Nfield supports customizable unsubscribe options, allowing you to tailor the process to align with your branding and compliance requirements.
Alongside this, Nfield provides a blacklist facility where you can keep track of email addresses which have unsubscribed, had delivery problems, been flagged as fake or should not be contacted for any other reason. These blacklists are compiled at domain-level, as another tool for helping you protect your email reputation.
The content and formatting of emails is another factor that can easily trigger spam flags if you’re not careful. Before sending out your email invites, you should evaluate them by using a spam score checker (such as mail-tester) that analyzes subject lines, content, formatting and other attributes that may be scrutinized by the “spam police”. This will help you avoid another deliverability pitfall, while resulting in emails which appear more genuine to the people you need to participate in your survey.
Following best practices for sending invitation emails is essential for online survey success, and Nfield has a number of in-built features to help you do this. For more advice on building a robust email reputation, and to find out why this matters, check out our related articles

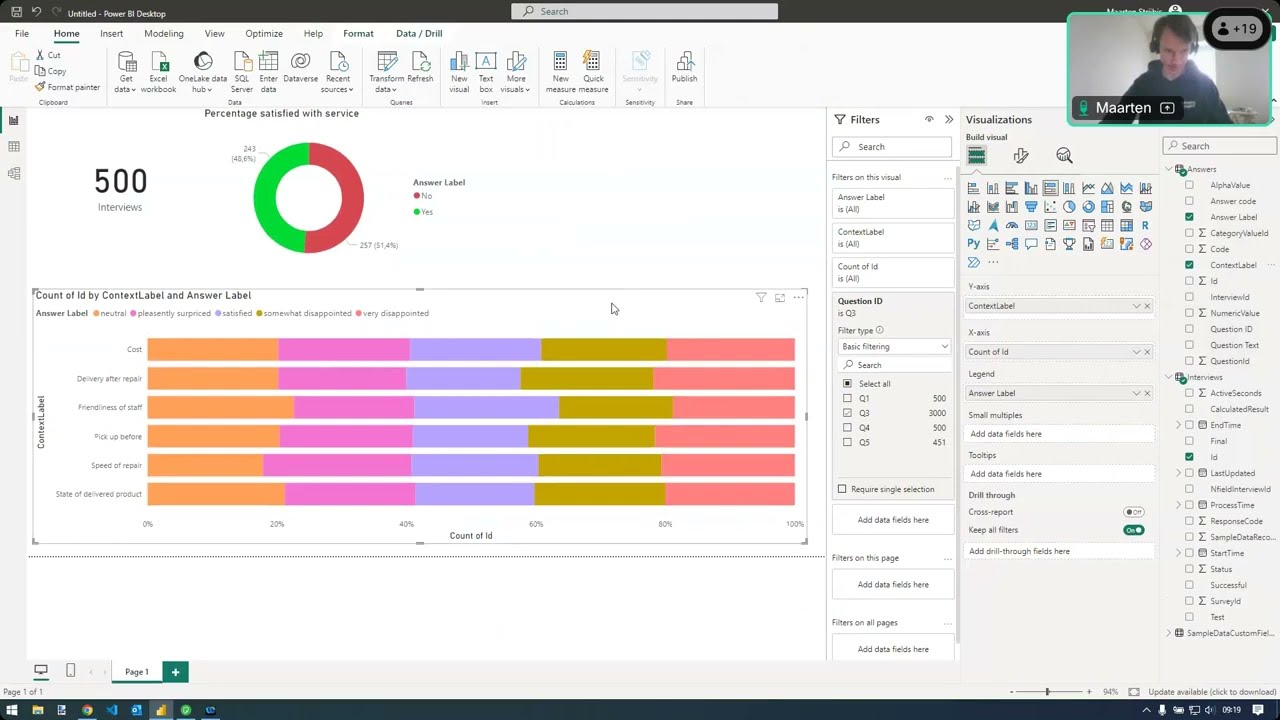
This session is an extension on NIPO Academy #24 (fieldwork report) and #35 (custom reporting) wherein we will show you how to create your own BI report.
This session concentrates on the different scripting debugging techniques and processes Nfield offers, by introducing a new feature called Simulate Interviews. This feature is a replacement and important enhancement on the generate dummy data option in the NIPO ODIN Developer.
Why spend valuable time on routine tasks that can easily be automated? If you’re using Nfield for Online and CAPI surveys, you can reduce manual workload by hooking up with Microsoft Power Automate. Nfield’s API enables seamless integration with this user-friendly automation tool, without the need for any coding.
Integrating Microsoft Power Automate with Nfield can speed up your operations, reduce errors and omissions, and keep communications flowing, while freeing your people to focus on applying their expertise.
Here are five examples of what Nfield and Microsoft Power Automate can achieve together.
Providing regular updates on project progress is good for client relationships, and demonstrates commitment to transparency and timely communication. But doing this takes time out of your day and can easily be forgotten.
With Microsoft Power Automate, you can schedule automated delivery of Nfield quota progress tables to clients, as often as you choose.
Survey respondents are the lifeblood of market research, so keeping them onside is crucial. Simple things like sending thank you notes for completing surveys goes a long way to building loyalty.
Microsoft Power Automate allows you to automate this. Reminding your respondents that their contribution is valued, and encouraging them to continue participating, without any members of your team having to disrupt their schedule.
For CAPI surveys, assigning addresses to interviewers is an essential routine task. But it takes time that can be spent on other things.
Microsoft Power Automate can take care of this work by automatically assigning new addresses to each of your Nfield CAPI interviewers as required, ensuring fair distribution of workload and optimizing how each field worker is used.
The faster your research team are informed, the faster they can get on with the next stage of their work.
Microsoft Power Automate can be hooked up with Nfield to notify them immediately when a survey quota target is met.
Everyone knows the importance of back-ups, which is why these should never be left to chance.
Microsoft Power Automate can initiate backup processes the moment fieldwork is complete. Ensuring this crucial task doesn’t get forgotten, while lessening your team’s post-fieldwork workload, so they can focus their attention on analysis.
Integrating Nfield with Microsoft Power Automate, via the Nfield API, enables you to optimize your market research operations in many different ways. From enhancing various communications to automating routine tasks, this powerful combination allows you to focus on what matters most – extracting meaningful insights from your data.

Automation of routine tasks is a great way to improve efficiency in any line of work. For market research companies conducting Nfield Online and CAPI surveys, this is easily achieved through integration with codeless tools such as Microsoft Power Automate and Zapier.
The beauty of no-code automation tools is they don’t require specialist expertise to set them up. All that’s necessary is an amount of familiarization with the tool and how it integrates with Nfield Manager via Nfield’s API. For the purpose of this demonstration, we’re showing how sending reports to clients can be automated using Microsoft Power Automate. This task is one of the Five ways no-code automation can improve efficiency in market research operations.
Here’s what’s necessary for integrating Microsoft Power Automate with Nfield:
| Your region | Nfield API Manual |
| Asia Pacific | https://apiap.nfieldmr.com |
| America | https://apiam.nfieldmr.com |
| China | https://apichn.nfieldcn.com |
| Europe | https://api.nfieldmr.com |
Our video follows every step of the process of setting up automated sending of quota progress reports from Nfield Manager using Microsoft Power Automate:
1. Log in to Power Automate (0:00 to 0:25)
2. Create a new flow with a schedule trigger* (0:25 to 1:05)
3. Create an HTTP connection for Nfield API authentication (1:05 to 2:54)
4. Extract and store authentication token (2:54 to 4:09)
5. Create another HTTP connection to retrieve the quota table (4:09 to 7:11)
6. Send an email with the quota table (7:11 to 8:12)
*In this example, reports are being scheduled to go out daily at 9am.

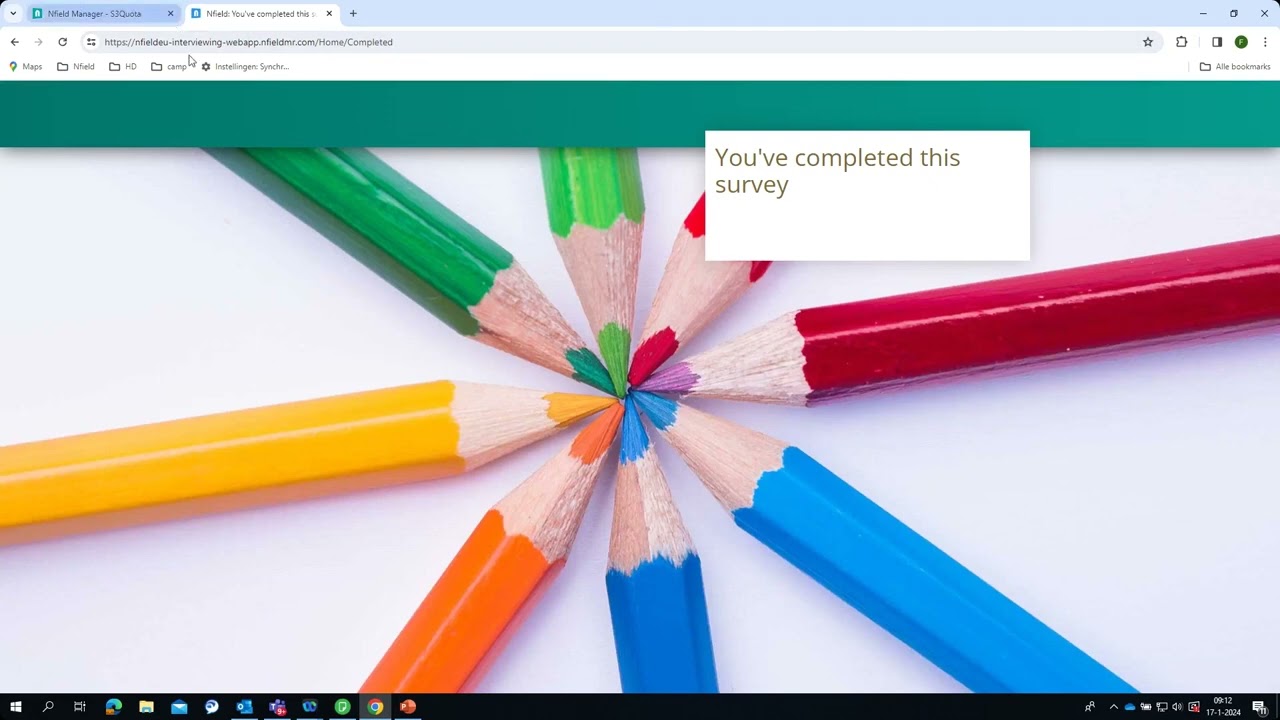
A common problem in online surveys is that respondents close their browser before the interview status is set, resulting in faulty interview counts and quota overshoot. In this NIPO Academy session we will talk about how to prevent this and how the new *ENDPAGE can help with this.
Happy New Year everyone! As we enter 2024, we hope you are looking forward to a positive year ahead. That’s certainly the case for us here at NIPO, where we never stop looking for ways to make Nfield even better aligned with users’ needs.
While we’re hard at work improving our products and developing new features, we thought this would be a good moment to reflect on the changes Nfield underwent during 2023. The 24 releases made over the course of the past year included the following major developments:
Keeping your Nfield domain clean – by deleting outdated surveys to avoid unnecessary data storage – is vital for your GDPR compliance, security, and efficient operation. Helping you achieve this is all part of our responsibility within Nfield’s ISO 27001:2013 certification.
To make it as simple as possible, we introduced an automatic survey clean-up feature. You can learn all about it in our 30-minute webinar Academy #39 Automatic clean-up feature session recording.
Maintaining a clean, clutter-free domain promotes internal collaboration and enhances teamwork. Doing this will also help you keep in line with Nfield’s acceptable use policy, making it less likely that you’ll incur additional charges from exceeding storage limits.
When you’re creating a new survey with the same configuration as one you’ve done before, starting again from scratch is a real waste of time, right? That’s why we introduced blueprints, which let you quickly set up new surveys based on identical channels and quota frames, without having to manually enter the details all over again. Pretty much like a template.
Thanks to blueprints, you no longer need to hold on to old surveys as setup references. Find out how to benefit from the efficiency of blueprints in our 22-minute webinar Academy #40 – Survey blueprints.
You wanted a more integrated and streamlined data management experience. We responded by developing a way to transmit CAPI data directly into the Nfield data delivery pipeline, enabling instant availability of comprehensive fieldwork progress reports.
This is still a work in progress, but Beta access is now open for integrating CAPI survey data into fieldwork progress reports and repositories.
Scripting continues to evolve, and so do our tools for checking your scripts are free from logic errors. The NIPO ODIN Developer now incorporates both the legacy (NFS) parser and the new (Nfield) parser for ODIN questionnaire scripts. At the time of writing, both parsers are currently available, but the legacy parser will be phased out during 2024.
While developing the new Nfield parser, we discovered several commands and constructs that are no longer functional in Nfield. To help you transition to updated practices, these commands and constructs are now proactively reported as warnings.
To make your CAPI survey experience even better, we enhanced Nfield Manager capabilities to enable truly seamless management, including for surveys with Sampling Points, Addresses, and Quotas. Day-to-day survey management is now even more streamlined via a more intuitive interface, and includes added support for Excel upload. As a result, the Nfield Manager lets you do more in one place, without having to use separate tools. So you get to enjoy even more convenience, efficiency and user-friendliness. This latest evolution of the Nfield Manager has led to retirement of the Classic Manager.
We know how frustrating it can be when you’re experiencing performance or availability issues and you don’t know if anything is being done to address them. That’s why we introduced our Nfield Status Page to provide real-time information about availability of our main services across different regions. Through this page, you can easily check whether the issue you’re encountering is already known to our team before deciding to raise a support ticket. It’s all part of our commitment to giving you the smoothest and most efficient service possible.
In 2023, we gave our users a gleaming new toolbox for streamlining the process of Nfield domain configuration. Nfield API Endpoints v2 is a set of meticulously crafted tools, such as DomainEmailSettings, DomainLanguageTranslations, and DomainPasswordSettings, designed to make your work faster, smoother, and better overall.
APIs (Application Programming Interfaces) act as a bridge connecting two completely different programs (e.g. Nfield and CRM / Nfield and Membership database / Nfield and your reporting system. See API – What researchers need to know for further explanation.
With the release of this updated toolbox, the older v1 endpoints have been deprecated, as indicated in the Nfield API help page.
Our improvement journey is continual, and Nfield customers can look ahead to yet more innovations aimed at further enhancing the user experience and data collection efficiency.
For every visible change, a significant amount of hardening, performance improvement, security enhancements, and maintenance work also goes on behind the scenes. It all adds up to fulfilling our commitment to delivering a robust and reliable platform for every single one of our valued customers.
Here’s to an exciting, inquisitive, and productive year ahead in market research!

We have extended the property filter for *USELIST to manage OR as well as AND statements. In this NIPO Academy session we will go over how this can improve your scripts.
NIPO recently had the pleasure of seeing one of our affiliates recognized by PAMRO (The Pan African Media Research Organization) for a groundbreaking project made possible by Nfield’s API.
Integrate, which is a data and evidence-based agency operating out of Morocco, was awarded the runner’s-up prize at PAMRO’s 2023 annual conference for “A Non-invasive Methodology for Tracking Digital Behavior in Morocco”. This pioneering initiative was designed to delve into Moroccans’ digital behaviors and attitudes, to shed light on their digital interactions and experiences. It was the first survey of the Moroccan population focused on gaining insights into their digital moments, with the aim of gathering valuable data for both marketers and researchers.
Nfield and its API were instrumental in enabling this research to be carried out, and we are delighted to share the details of how these made a difference.
Integrate pursued a non-invasive methodology to overcome privacy concerns which often deter respondents from granting permissions, thereby limiting the tracking scope. It was a decision designed to enhance the level of participation.
Compared to other approaches that use real-time monitoring via in-moment tracking tools, such as web analytics, cookies, and software installed on users’ devices, non-invasive market research relies on self-reported data. This presents two challenges:
Because non-invasive market research can’t use online activity to trigger surveys, Integrate needed another way to collect data in a timely fashion from trustworthy respondents. Their solution was to prompt respondents, selected from a pre-vetted panel, into voluntarily providing information through time-restricted SMS invitations. To encourage participation, rewards were offered for in-time survey completion.
To carry out these procedures, Integrate implemented a set of strategic rules executed by a job scheduler, while the Nfield API enabled tasks to take place automatically. As a result, Integrate was able to track digital behavior, brand exposure, meal occasions, and other relevant time-related activities without human intervention, while solving the challenges described above.
| Purpose | Rules | How Nfield’s API helps | |
| Job Scheduler | Real-time engagement: Obtain the most accurate responses possible. | Participants are contacted via SMS, as close as possible to the moment of their experience. | Seamlessly uploads respondent sample group data from a panel database and creates unique survey links for sending via SMS. |
| Time-sensitive queries: Minimize risk of memory bias. | Each survey is exclusively focused on events that took place within the last hour. This is assured by invalidating survey links one hour after sending. | Automatically quality-checks submissions (according to Integrate’s custom algorithm) one hour after links have been sent, and invalidates unique survey links for any interviews not completed within that timeframe. | |
| Motivate respondents: Encourage higher response rates, to acquire more valuable data. | Participants are rewarded for completing surveys. | Triggers the process for sending rewards to respondents who completed surveys within the timeframe, to the desired quality. |
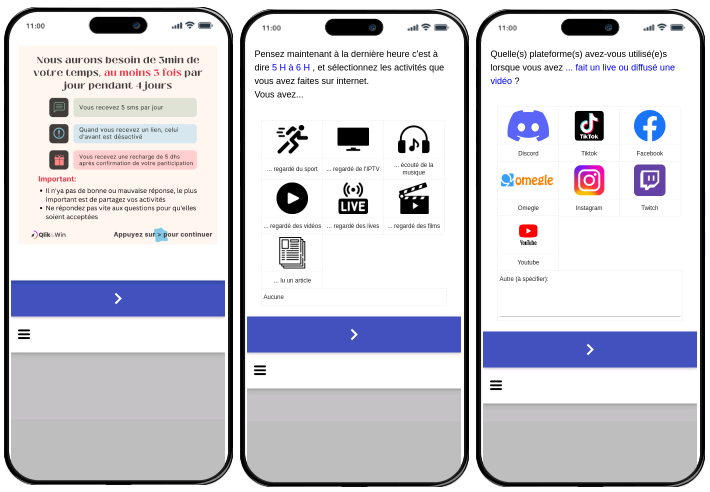
In addition to feeding the job scheduler, the Nfield API also helps to minimize memory bias by transferring information from the panel database into Nfield, where it is used to customize how questions are presented to each respondent. This helps jog respondents’ memories in a way which is already known to be relevant.
Nfield’s ability to incorporate visual aids, in the form of pictograms, in the survey design means this knowledge can be presented in a way that makes it even easier for respondents to recognize, and accurately recollect their digital interactions and experiences.
Integrate’s study revealed diverse digital segments with associated demographic details, attitudes, key online activities, expenditure, and preferred applications, without resorting to digital surveillance that would discourage respondent participation. The data they gathered is invaluable for businesses seeking to target distinct digital consumer groups in Morocco.
This non-invasive methodology can be extended as required to study other aspects such as brand exposure, moments of consumption, and time and activity diaries. Thanks to Nfield’s API making it easy to carry out, market researchers have another feasible option for reaching diverse target groups.
If you’d like to know more about this particular case, please contact [email protected] at Integrate.
Here at NIPO, we’re always thrilled to learn about our clients’ successful research endeavors. As well as giving us an opportunity to celebrate your achievements, knowing about your experiences contributes to our continuous improvement. Plus, your successes inspire and support fellow researchers, fostering a community of innovation. So don’t hesitate to share your successes using Nfield. Together, we can continue to push the boundaries of market research, and Nfield will be there to support you every step of the way.

Quality data is the very bedrock of worthwhile market research. Survey results that are skewed through inappropriate responses are helpful to no-one. And the insights derived from these could potentially do more harm than good if used as a basis for strategy.
That’s why we’re excited to introduce a new tool to the Nfield armory: ReDem® AI-powered quality control for survey responses. ReDem AI automatically scans every survey answer for integrity, identifying and disqualifying those which are likely to be invalid due to respondent laziness or deliberate falsification. Our team has worked together with ReDem to integrate their service with Nfield, so you can hook up their capabilities directly with your Nfield surveys.
This is in addition to Nfield’s manual facility for identifying and disqualifying responses which show evidence of being falsified, as described in Upholding Survey Quality: How to Remove ‘Bad’ Interviews from Results.
 Information
ReDem is a leading research technology company specializing in AI-based SaaS solutions for survey data quality assurance. ReDem aims to improve quality control in the insights industry by bringing better efficiency and standardization to data cleaning.
ReDem uses artificial intelligence to check data quality, doing everything you can do through Nfield’s manual facility, but in a fraction of the time. And without the risk of human error that increases as concentration gets lost.
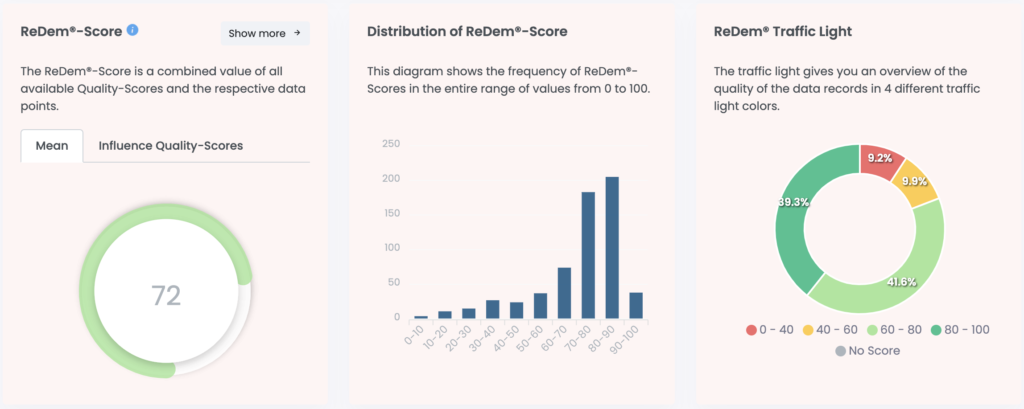
Learn more about ReDem-Score – The quality checks performed by ReDem and AI-powered quality checks for open-ended responses.
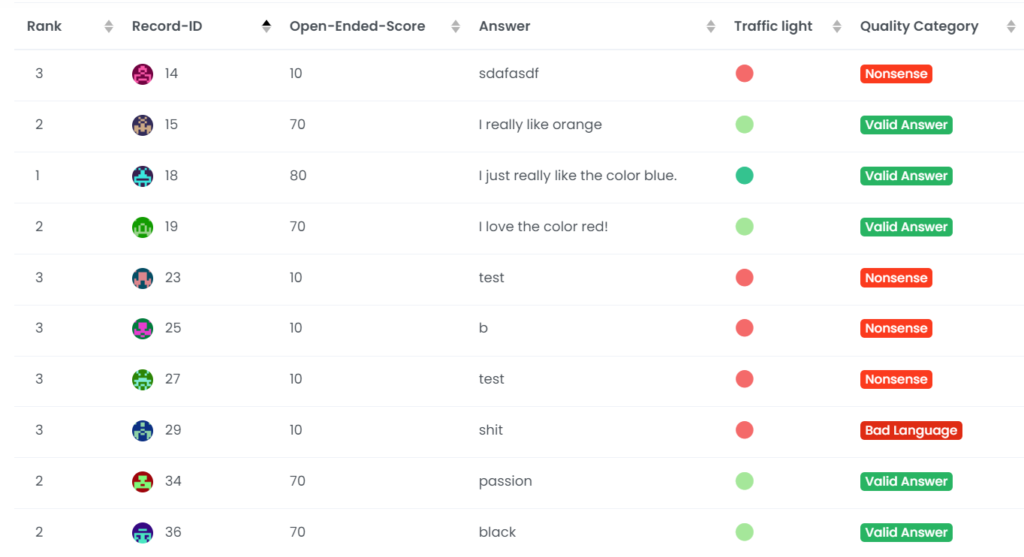
ReDem AI swiftly identifies any survey responses that fall below user-specified benchmarks, and flags them as rejected within Nfield. It also marks good quality interviews as approved. This proactive approach guarantees your results only contain high-quality data, which safeguards the integrity of derived insights.
Want to see exactly what the Nfield-ReDem integration can do for your surveys? We organized a webinar in 2 sessions on 30 and 31 October 2023. See the session video below.
NIPO and ReDem are proudly working together to shape the future of market research by ensuring top quality data that’s suitable for deriving genuine insights. Join us on this journey transforming how we understand the world through data.
In the third webinar of the subset of NIPO Academy sessions, called “The scripting problem of the month” we will discuss how to control starts and restarts of an interview.
Market research is all about helping organizations stay ahead of their competition. To be successful, market researchers themselves need to lead by example, using tools which leverage cutting-edge technology to produce thorough insights, in any given situation.
NIPO’s Nfield platform does all this, at the same time as considering research companies’ own business needs. With unwavering commitment to security and compliance, robust architecture, user-friendly design, and seamless API integration, Nfield provides a game-changing package for even the most complex data collection and analysis projects.
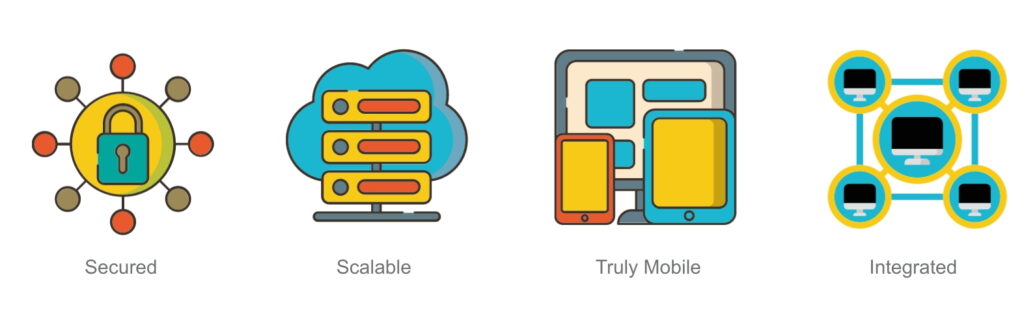
Data security is paramount in every business situation, and carries a whole new level of responsibility when data from a large number of third-parties is involved. Nfield is as prepared for this as it is possible to be. Certified to ISO27001, the international standard for information security management systems, Nfield guarantees all data is safeguarded against any unauthorized access, theft, or damage.
This highest-level certification is complemented with GDPR compliance, meaning Nfield adheres to the stringent General Data Protection Regulation set forth by the European Union (and CCPA).
For market researchers and their clients alike, this combination of data security and privacy compliance gives full peace of mind that everybody’s valuable and sensitive information is in safe hands. To learn more, visit the NIPO Data Security page.
Read More:
Faultless ISO 27001-2013 audit for Nfield
Keeping your Nfield domain clean for compliance, security and efficient working
Market research clients come in many different forms and seek insights from all kind of places. That’s why Nfield has been designed to seamlessly accommodate every eventuality, without missing a beat.
Leveraging the power of the Microsoft Azure PaaS environment, Nfield scales automatically as and when necessary to provide the right capacity for every size of project. And, thanks to strategically positioned servers across Europe, Asia Pacific, China and America, offers the fastest possible response times for researchers and respondents alike, wherever they’re located.
Nfield’s dedicated operations team continually maintains the platform to ensure reliability and uninterrupted access. Making the most of Microsoft Azure’s features and capabilities, including high availability and disaster recovery, Nfield delivers consistent and reliable performance to every size of company, all around the world.
Read More:
Seamlessly Migrating a High Volume Online Survey
Nfield sets new activity record, with 104,758 interview completes in 24 hours
Market research doesn’t all take place at a desk. That’s why Nfield is as mobile as the world we live in. The platform, complete with its responsive, user-friendly design, is effortlessly accessible via smartphones, tablets, laptops and desktops. So there are no limitations to where and when responses can be gathered.
Read More:
Bringing True Mobility to your Surveys
Customer Satisfaction Surveys: Nfield brings you Closer to Impactful Outcomes
Employee Satisfaction Surveys: Superior Nfield Capabilities leave Clients more Satisfied too!
Nfield’s API enables seamless connection with other software solutions of your choice, such as customer relationship management (CRM) systems and analytics platforms, to streamline workflows and enhance data accuracy. With endless possibilities for automation, data transfer and generation of custom reports, Nfield’s API integration can supercharge productivity while facilitating next-level customization.
Read More:
API – What researchers need to know
In our fiercely competitive world, speedy ability to leverage data-driven insights is key. Leaving no stone unturned in this highly complex task, Nfield is the ultimate industrial-strength survey platform for market research companies that really mean business. Nfield’s scalability and reach mean companies of every size, and in any location, can be empowered by fast, user-friendly processes that take our industry to the next level.

Request a demo to see how NIPO can help you meet your requirements with our smart survey solutions.