
Get a first impression, scheduled soon.
Request a demo to see how NIPO can help you meet your requirements with our smart survey solutions.
NIPO recently introduced a new subset of NIPO Academy sessions, called “Scripting problem of the month”. This session is about the use of randomizations.
NIPO is introducing a new subset of NIPO Academy sessions, called “Scripting problem of the month”. In this new series one of our scripting experts will take half an hour to discuss a scripting issue that we often see in NIPO ODIN scripts. The first topic we will discuss is: Optimizing loops; how to minimize the loops and the iterations.
We are happy to announce the release of the Survey blueprints feature. With survey blueprints we are introducing a new method in Nfield to create a survey based on a model. This will speed up the creation of surveys with common characteristics and reduce errors for creating standard surveys. In this series of NIPO Academy sessions we will take you through this new feature and if you like what you see we will activate this on your domain.
Nfield is a powerful cloud-based platform that’s specifically designed for conducting Online and CAPI surveys. Its ability to support high respondent numbers and complexity makes it an invaluable tool for professional market researchers in every field, whether working for businesses, authorities or in academia, to name just three examples.
Nfield provides comprehensive, end-to-end solutions, all the way from survey design to data collection and review. It facilitates fast, efficient working, while being highly customizable to individual requirements. And, very importantly, it’s easy-to-use.
Let’s take a look at the range of functionality Nfield offers:

Nfield’s user-friendly interface brings simplicity to designing complex surveys. It supports a wide range of question types to cater to every need, including multiple choice, rating scales, grids, and open-ended. Nfield also enables easy handling of complex survey logic by providing features such as skip patterns and branching.
Responsive design, which is all part of the Nfield experience, ensures surveys are displayed in the right way for every screen they’re viewed on, whether that’s a mobile phone, tablet, laptop or desktop computer.
With Nfield, you’ve therefore got everything you need to create surveys that are engaging, interactive, and tailored to each specific target audience. Which ultimately delivers better response rates and more comprehensive data to work with.
Nfield Online surveys can be distributed via email invitations, web links, and social media, so you can choose the most suitable method(s) in every case.
Nfield CAPI surveys, which facilitate offline survey data collection from face-to-face interviews, can be distributed to field interviewers according to your chosen sampling method, whether that be address-based, free intercept or something else. Nfield CAPI enables surveys to be conducted even in remote areas without reliable internet access, while being flexible enough to collect data via various devices, including mobile phones and tablets. With all this, Nfield CAPI offers a truly efficient solution for fieldwork, in whatever location or form it takes place.
For CAPI surveys, Nfield’s Interviewer Management feature enables management of interviewer workloads and monitoring of whether interviews are being conducted as specified. It has tools for assigning interviews to specific interviewers, monitoring progress, and tracking performance.
Collecting survey data is, of course, as essential as getting well-designed surveys in front of the right respondents. Nfield runs in the highly reliable and scalable Microsoft Azure cloud, which robustly supports the handling of large volumes of data and smooth survey execution.
At the same time, Nfield security measures ensure participant data is protected at all times, so both you and your respondents can have peace of mind that their data is safe and secure.
Nfield’s Fieldwork Monitoring features give researchers the ability to track and view survey progress in real-time. As well as monitoring response rates, completion rates, and interview durations, it’s also possible to view the collected data via filters which can be set to things such as demographics or response patterns.
Nfield’s Data Repository feature provides a centralized location for storing and managing survey data. This is very advantageous, as it means custom reports can be generated in real-time. By automating the reporting process and enabling fast creation of reports in a variety of formats, this feature saves researchers a lot of time and effort.
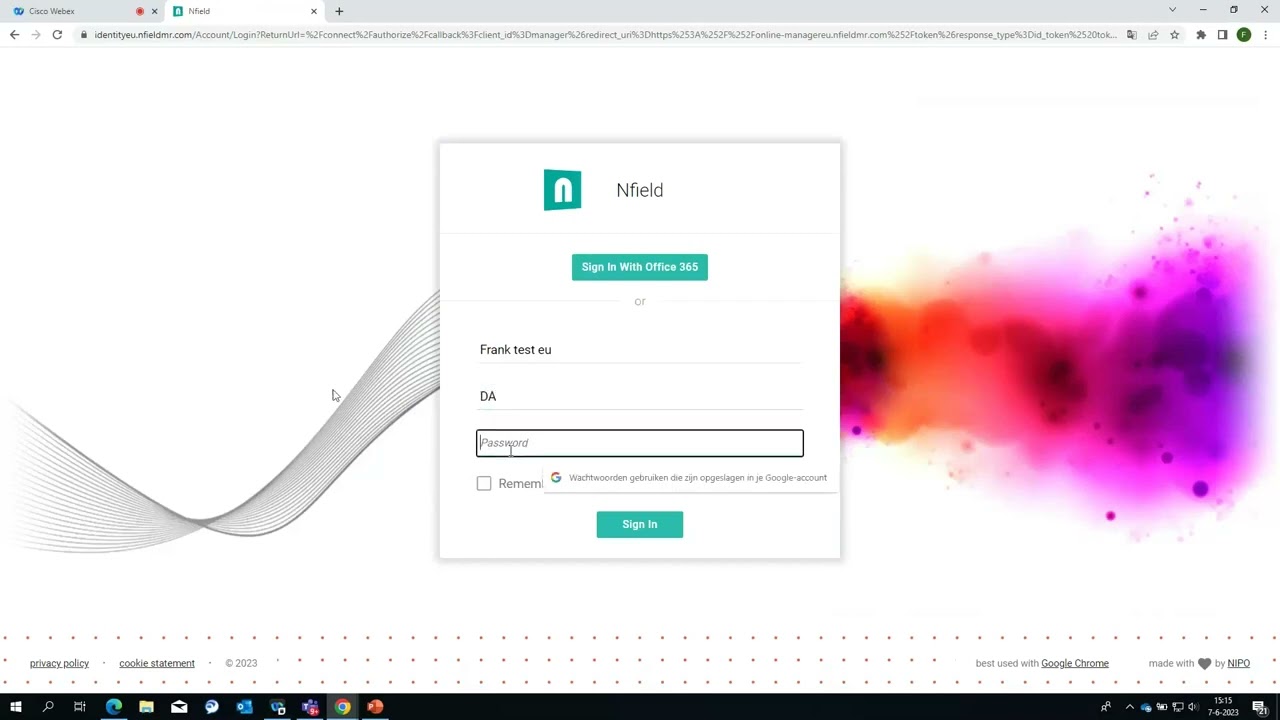
Nfield’s versatility makes it ideal for all kinds of different sectors and purposes, where market research might cover anything from commercial insights to practical user studies, political leanings and employee satisfaction. Here are just a few examples of survey types that can be conducted using Nfield:
You’re never on your own with Nfield, as we provide a wide variety of supporting materials and resources.
The NIPO Academy section offers a range of training videos and webinars that cover topics such as Academy #33 – Nfield Online introduction session, and Academy #25: CAPI in the new Nfield Manager II. These videos provide a great starting point for those who are new to Nfield or want to refresh their knowledge.
In the Nfield Manager, you’ll find a range of support materials, including user guides and technical documentation.
And for further personal assistance and guidance, you can always reach out to NIPO’s customer support team.

We noticed that most domains on Nfield have orphaned surveys. Surveys that have had no activity for a long time. To help managing these surveys, NIPO introduced a new Automatic clean-up feature for inactive surveys. In this series of NIPO Academy sessions we will take through all the details of the feature and explain how to exempt surveys from this process.
Among the many decisions you have to take as a market research professional, choosing whether to distribute each online survey via a generic or unique links is more important than it might at first seem. However, armed with the right guidance, you should be able to identify the best option in each case, without too much difficulty.
Here are the benefits, drawbacks and reasons to choose each option, together with how to generate these links in Nfield.
Unique survey links are when every invited respondent is assigned their own personalized URL to access the survey. The overarching benefit of using unique links is that you can track individual responses and identify which participants have completed the survey. Because unique links can only be used once, they also reduce the chance of your survey being infiltrated by robots.
Situations where unique links are the best choice include:
You will need to include individual respondent keys as part of your sample upload, then add these keys to the end of your generic survey URL – so genericURL/[respondentkey] – to create all the unique links. Alternatively, you can get Nfield to automatically generate the links when sending out the email invitations. When you have an integration between Nfield Online and an external source, such as a panel provider, your panel provider can easily arrange it in the panel system. This ensures each participant receives a unique link that can only be used once.
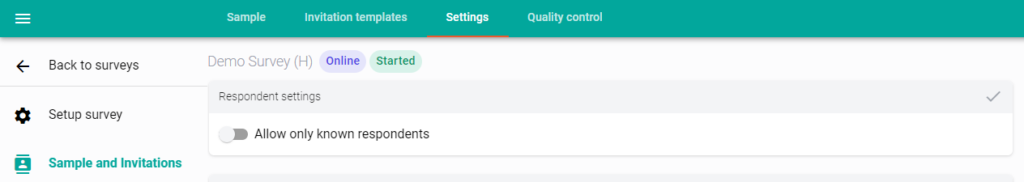
The “Allow only known respondents” option.
A generic survey link is when all potential respondents receive the same link to enter the survey, regardless of their identity or demographic. The overarching benefit of using a generic link is that it’s quick and easy to distribute to a large number of people, because you can simply share the same link via emails, social media, or any other channel you want to use.
A couple of pointers for when to opt for a generic link:
However, it’s worth noting that online surveys can sometimes suffer from high dropout rates, which can impact the overall quality of the data collected. If you’re interested in learning more about the reasons behind high dropout rates in online surveys, we recommend checking out this insightful blog post on Online surveys suffering from high dropout rates? This may be why. It provides valuable insights and strategies to mitigate this issue, ensuring a higher completion rate and more reliable survey results.
Because a generic link gives you less control over who’ll respond, it’s important to set a survey quota target. This will ensure you receive a representative sample of responses from your target audience and reach your desired sample size, while helping prevent the survey from being over-subscribed.
To set up a survey quota target in Nfield, simply navigate to the Quotas tab and define your target based on the relevant criteria (e.g. age, gender, location). Further information can be found in NIPO Academy #27 Quota: Existing features and new additions.
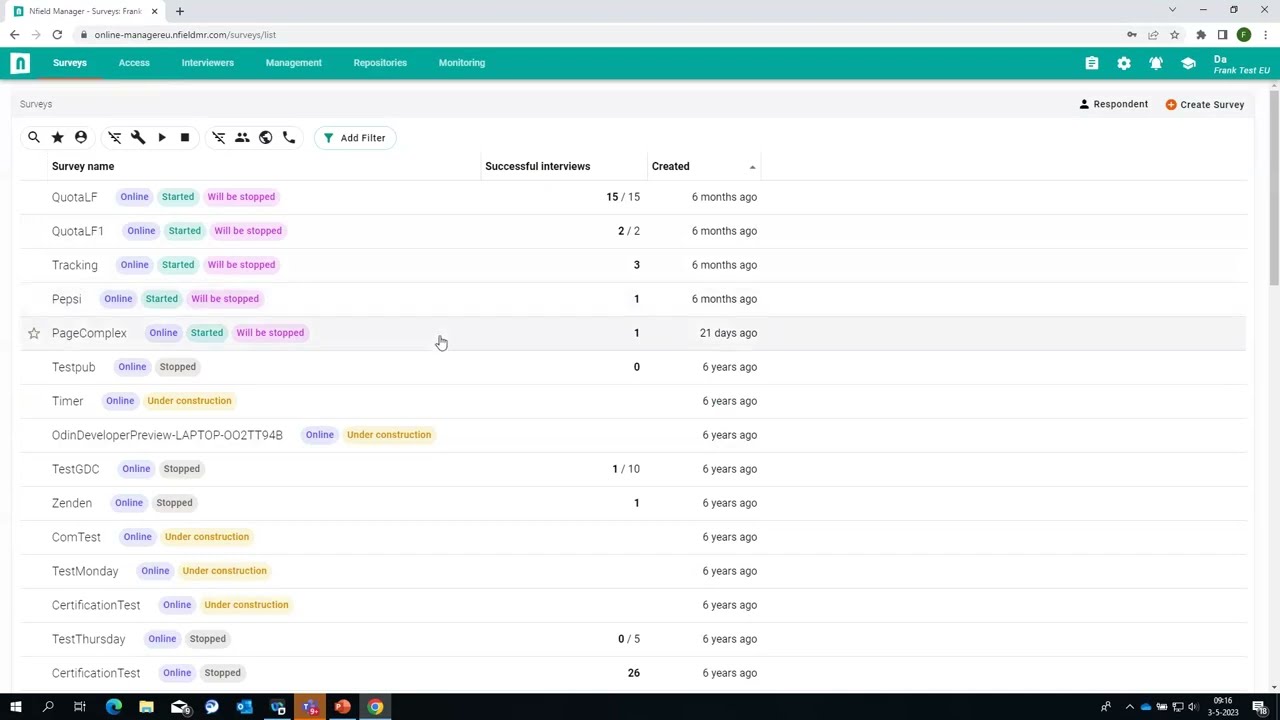
Simply navigate to the Nfield Launch panel and select “Copy Live Link” under the “Copy Interview Links” session to retrieve your survey’s generic link.
Whether you should opt for a generic or unique links for each online survey depends on your specific goals and objectives. If you need to track individual responses or personalize the survey experience, then unique links are the way to go. On the other hand, if you need to reach a large audience quickly or maintain participant anonymity, then a generic link is the best option.
If you have any questions about survey link types and how to generate them in Nfield, please feel free to contact [email protected].

As a highly responsible SaaS provider to market research companies, NIPO, the company behind Nfield, fully understands the importance of protecting personal data and safeguarding against potential data breaches. Alongside our own comprehensive measures to prevent data breaches and swiftly lock down in the event of these being bypassed, we are also committed to helping our clients do all they can to protect their valuable data within the Nfield platform.
NIPO has the following measures in place to prevent data breaches:
 Info
Info
Secura is a well-known and trusted company that specializes in providing cybersecurity services to organizations around the world, and we use their expertise to identify any potential loopholes in our code. By leveraging a combination of manual and automated testing techniques, Secura helps ensure Nfield’s code is secure and can withstand potential attacks from cybercriminals. This approach to security ensures that Nfield can maintain the highest standards of data protection for our customers.
In the unlikely event of a data breach, NIPO has a dedicated incident response team that follows a well-defined plan to mitigate the impact. This plan includes the following steps:
It is also vitally important that market researchers implement all available measures to protect respondents’ personal data and adhere to GDPR, or other applicable local regulations. At NIPO, we provide resources to help our clients with this, including our GDPR and Nfield Toolkit.
Here are some other simple steps you can take, which include making use of tools and features included in our Nfield platform:
At NIPO, we are committed to protecting personal data and safeguarding against potential data breaches. By implementing a comprehensive security strategy and incident response plan, we are prepared to handle any potential security incidents quickly and effectively. We also provide resources and guidance to help our customers protect themselves and adhere to GDPR regulations. With our commitment to data security, NIPO remains a trusted partner for market researchers looking to conduct research in a secure and compliant manner.
If you suspect a data breach or security incident related to your use of NIPO’s services, please report it immediately by contacting our Data Protection Officer at [email protected]. Reporting a suspected data breach promptly helps us to take swift action to contain and mitigate the impact of the incident. We take all reports of data breaches seriously and have a dedicated team in place to investigate and respond to incidents as quickly as possible.

Voice and video recordings are often used in Online and CAPI surveys to extract deeper responses. But what respondents say and do in these recordings doesn’t always tell you what they really think. You can, however, use voice analysis software to reveal the true emotions behind spoken words.
Social norms mean people tend to behave politely when answering survey questions. And busy lifestyles mean they may not have fully thought through their responses.
Considering that 95% of purchasing decisions are subconscious1, and 38% of vocal communication comes from tone of voice, rather than words themselves2, it becomes clear that relying on words alone for market research can miss a lot of essential details. Consequentially, most researchers aren’t getting the information they need to understand what really matters to people and drives their behavior.
In our continual quest to keep Nfield at the forefront of professional market research, we came across a voice analysis solution called Phebi and decided to put it to the test.
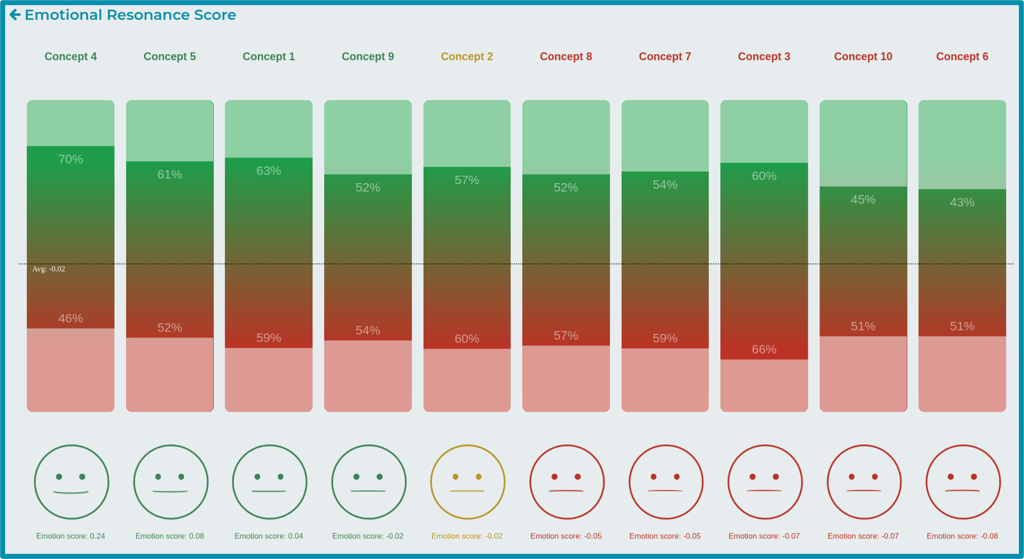
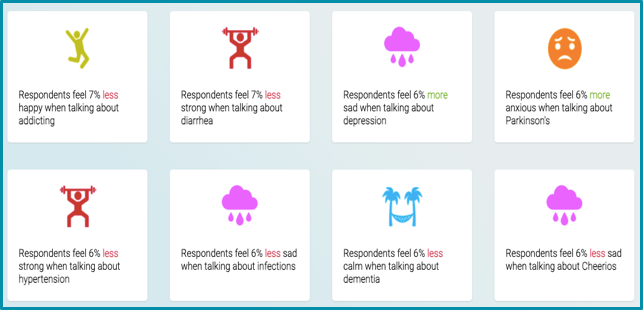
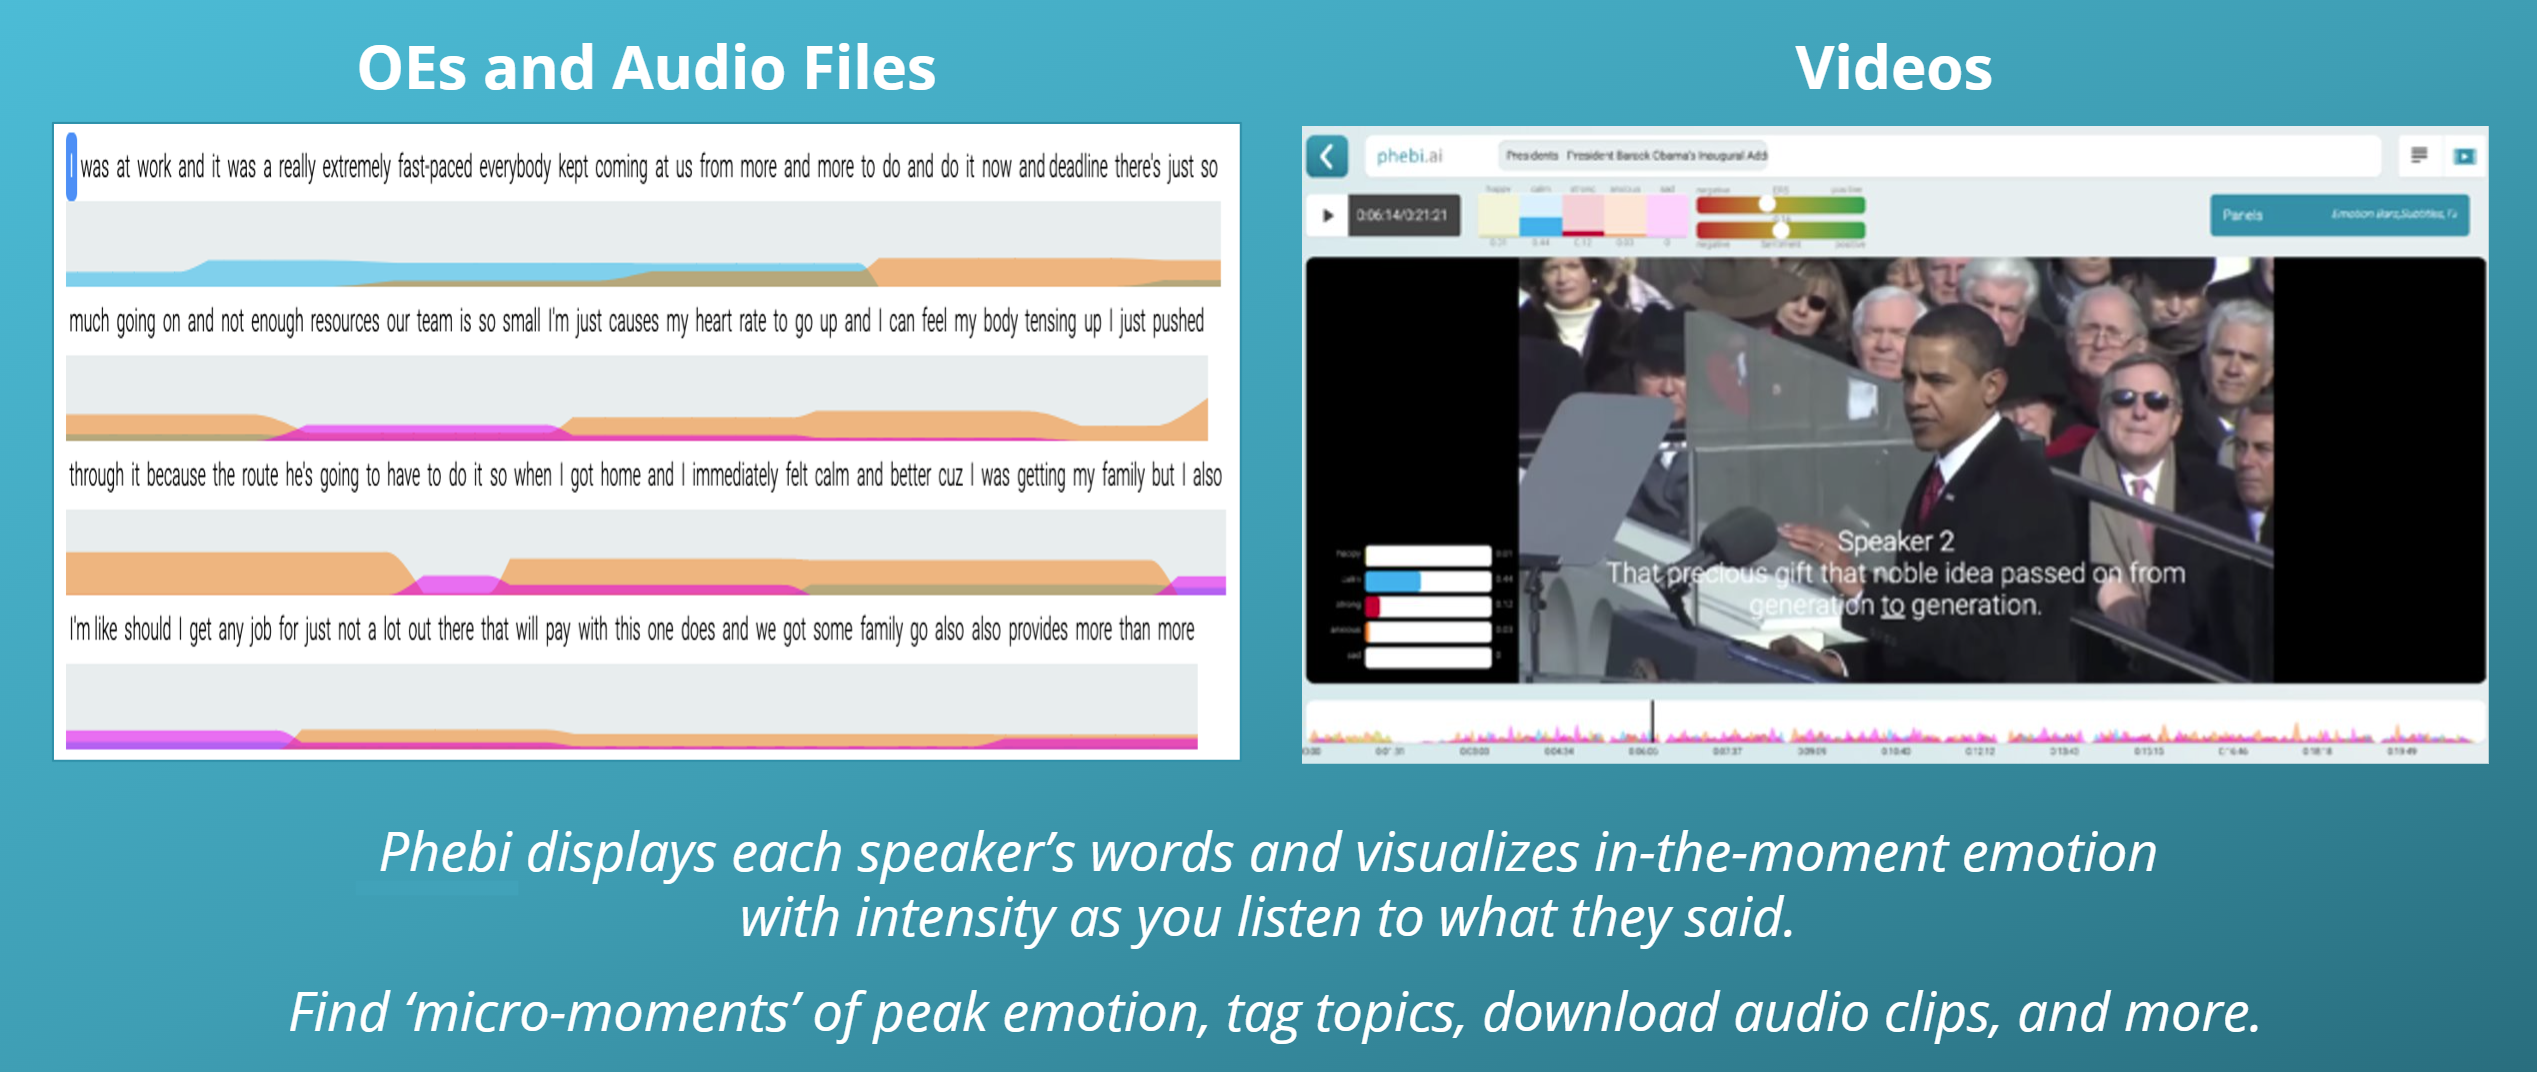
Phebi analyzes speech and breaks it down into what has been said (sentiment) and how it was said (emotion). It does this by checking voice characteristics, such as pitch, rate and tone, every 3 seconds to detect and quantify the underlying emotions. Phebi’s methodology is based on well-accepted social science research and validated via 38,000+ hours of testing.
Phebi’s emotion analysis examines many factors to determine levels of five underlying emotions:
Having put it through its paces, we concluded that Phebi is a useful complement to Nfield Online and CAPI surveys instantly delivering accurate, quantified analysis of people’s nonconscious responses that goes beyond the words they say.
We were also impressed by Phebi’s auto transcription and translation function. In CAPI interviews, we found it could differentiate between interviewers’ and respondents’ voices.
Phebi features include:
Phebi can easily be used to analyze Nfield voice recordings via a simple connection.
Recordings from Nfield Online surveys can be automatically uploaded to Phebi’s server. For Nfield CAPI surveys, you should continue using the built-in Nfield recorder and upload all your audio files to Phebi in batch.
After feeding your audio recordings into Phebi, you’ll immediately be able to see various reports, such as the ones shown below, in the Phebi portal.
If you are interested in using Phebi’s software, please contact them directly at [email protected] for a live demonstration and answers to all your questions about their product.
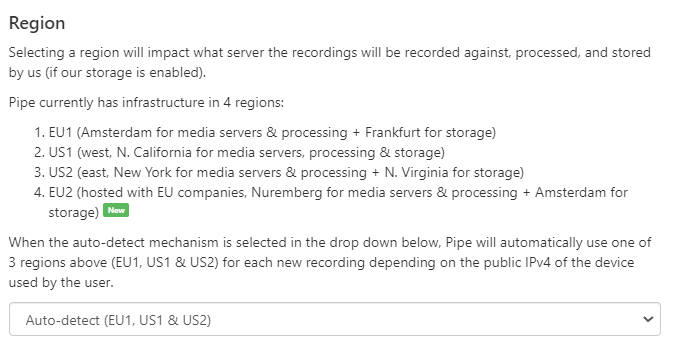
Note: Phebi’s servers are located in the USA, Europe (Germany) and Australia.

As a creator of truly purposeful survey solutions, we want every user to be able to get the best out of them. That means ensuring our customers fully understand what our products are capable of and how to utilize that capability to their own advantage.
Because our Nfield survey platform offers such a wide range of features, specifically designed to meet professional market researchers’ needs, there is a great deal to know. We therefore take a step-by-step approach to educating every individual customer, so the right knowledge is gained at the right time and nobody ever feels overwhelmed.
The Nfield learning process starts while you’re still considering whether we’re right for you. If you decide to come on board with us, we’ll get you fully up-to-speed using your product and continue providing guidance and, if required, access to external support services, for as long as you are an Nfield user.
A member of the NIPO Sales Team in your region will discuss your specific needs and determine whether, and how, Nfield can meet them. We want to forge successful long-term partnerships which means making sure you’ll be delighted with our service, so we start by carefully assessing whether we are right for each other.
While doing this, we’ll talk you through the various features Nfield offers for conducting online, face-to-face and (soon) telephone research, as necessary. We’ll point out the things you’ll need to consider, such as the possibility of needing additional training on some of our more advanced features or paid-for optional services (e.g. scripting, styling) delivered by an external partner.
Of course you’ll be keen to see Nfield in action, so we are happy to oblige via a live demo. We’ll schedule an online session that demonstrates scenarios related to your own requirements. Upon request, we can record the session so you can then share it with others in your organization.
Once you’ve signed up to Nfield, the sales representative you dealt with will hand you over to a member of our support team, who’ll work with you to get you up and running. Because the NIPO sales and support teams are closely integrated, the information we’ve already shared will be readily available to every support team member. So you won’t have to explain yourself all over again and they will be fully prepared to set you up.
We’ll start with a free 2-hour introductory training session, during which you’ll learn how to use the system and launch a survey, as well as other basics which are relevant to your specific needs. You’ll then be ready to start putting Nfield to work.
We’ll introduce you to our support website where you can access documentation, training and NIPO Academy videos, consult support cases and get useful tools.
You’ll have access to our Helpdesk support team who’ll be happy to help with any problem you might encounter. Our support policy is to respond within 24 hours, but in practice we usually address queries much sooner. Support is free and provided from 2 locations: Amsterdam and Mumbai. In the event that your closest support center can’t respond fast enough, another center will handle the issue so you’re not kept waiting. There are no limitations to the number of support queries you can submit. If we feel the type of support requests indicate additional training is required, we’ll discuss this with you.
Via the NIPO Academy, we regularly present free webinars about new Nfield features, best practices and troubleshooting. You can see a recent session wherein we did the Nfield Online introduction training session.
Once you’ve become comfortable with using Nfield, you might want to get trained in advanced skills such as scripting, effective fieldwork management, safeguarding email reputation and many more. ODIN scripting, which gives you the power to fully customize NIPO survey functionality, is a particularly popular course. A lot of Nfield users also like to bring us in to train their newcomers. Please note that Advanced Training and onboarding new personnel are paid-for services.
Because some of our customers prefer to focus on their core market research activities, rather than also getting involved with more technical matters, NIPO has teamed up with an external partner to offer services for:
Nfield users who have acquired sufficient knowledge to independently conduct research on the Nfield platform have the opportunity to get certified. NIPO provides a training and certification program with courses that teach you more about survey scripting, ODIN Developer capabilities, managing fieldwork and market research in general. More information.
Our onboarding process and follow-up support and services enable every customer to get the most out of Nfield. From feeling comfortable at the start to becoming an expert over time, with access to all the materials, information, tools and services you need to work in the most productive way.
If you’d like more information on how we can help you, please contact us at [email protected].
See what Nfield can do for you, ask us for a live demo.

It’s natural for researchers, fieldwork managers, sample managers and sample providers to want the highest possible completion rate for every online survey. And while a certain amount of dropouts are to be expected, alarm bells can start ringing when the percentage appears to be too high.
If there’s no obvious explanation, such as the survey being very time-consuming or poorly presented, the reason may be a technical one. Having investigated a number of reported survey dropout cases at NIPO, we have identified five likely technical causes, along with ways to mitigate them:
If you’re concerned about overly high dropouts in any of your surveys, it could be worth looking into these possible causes.
When an ‘anonymous link’ to a survey is shared on a social network, allowing anyone who finds it to enter the survey, you can expect bots to pick up on it and ‘give it a try’. We have observed a number of surveys with literally millions of interview starts that can be attributed to bots, rather than human respondents.
These starts can be recognized in your survey data, as there will be no answers to any of the survey questions. You may still see automatically generated ‘respondent data’, such as device detection, which has been run before the first question is shown. But no data other than that.
How to prevent it
Add a simple landing page between the link and the actual interview start. All it needs to have on it is some text that introduces the survey and asks for confirmation to continue, with a button that brings the respondent into the actual interview.
When tested on previously mentioned cases with the millions of dropouts, which were suspected as being caused by bots starting the interviews, this simple trick lowered the dropout rate from over 99.9% to below 10%. From this, we concluded that (most of the) bots that were causing the high dropout rates do not follow up (by ‘clicking the button’) after the initial request.
It’s understandable that you may feel hesitant about adding ‘yet another screen’ to the survey. But if it already has an introduction page, on which the respondent is only required to click a button, why not simply move this page up the order, as described above?
Why ‘non-legitimate’ interview starts matter
Of course, there are also bots which are smart enough to follow up on some questions and provide pseudo answers. When that is the case, the simple landing page solution will not work.
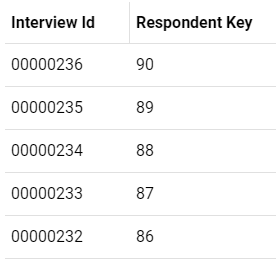
Even if you don’t share your survey link via a social network, but invite all your respondents personally, providing each with a link containing a unique Respondent Key, bots can still find these and ‘give it a try’. Some smart bots even make up Respondent Keys that they then try.
How to prevent it
As in example #1 (Bots hitting on ‘anonymous link’ studies), a landing page can help. But if the bot is somewhat smart, this alone may not resolve the issue.
If you observe your survey being ‘polluted’ with Respondent Keys you did not hand out, you may want to set the ‘Allow only known respondents’ setting to True. With this option set, Nfield will only allow respondents with Respondent Keys that have been uploaded into the survey sample table.
If you share personalized links (containing unique Respondent Keys) via email to specific respondents, dropouts can also be caused by the respondents’ email service providers checking that link as part of their automated security process. It is common for email service providers to follow links in emails sent to their customers to check they don’t trigger malicious action. We know, for example, that Google, Hotmail and Yahoo do this to protect their users.
Following these links often means opening them, which causes the interview to be started. The email service provider will conclude that the link is safe, but until the email recipient (i.e. the actual respondent) also clicks that link, the survey will be considered by Nfield as a dropout, because the survey was started but not finished.
How to tell if this is the cause of your dropouts
Take a look at the times these unfinished interviews were started. If you see many dropouts at around the time, or shortly after, you sent out your email invites, this is a good indication.
Before respondents are even shown their first question, many Online surveys begin by automatically running processes to establish the respondent’s device and browser (to determine how the questions should be rendered) and to verify the link that started the interview has not been tampered with.
These processes often involve Nfield interviewing making API calls to services which are external to Nfield. These API calls are not always performed as well as they should be, especially when the load is high. When an API request takes too long to be serviced, Nfield can give up on the request and time out. Without getting the response necessary for the interview to start, the respondent also gives up and closes the browser.
Sometimes these API requests just fail. If no appropriate measures have been taken in the questionnaire script to deal with a failing request, the script can run into an error. When the respondent sees this, they drop out.
A less frequent cause of high dropout rates can be an issue in Nfield itself.
NIPO mitigates issues once these have been reported or recognized. Depending on the severity, hotfixes can be put in place.
Consider each of the first four possible causes described above, and see if you observe anything that indicates any of them as the likely cause. Then take the suggested action.
If, after doing this, you still think what you see is the result of a bug in Nfield, create a support ticket. Share as much detail as possible.

Market researchers examining in-store shopping behavior are increasingly asking us for virtual shelf functionality.
Traditionally, researching this subject has been done by setting up physical displays and inviting shoppers to the relevant locations. However, this is an expensive exercise. And since the coronavirus pandemic, online methods for capturing shopping behavior have become very popular.
In response to this rising demand, we have been working with ConceptSauce to understand their solutions and develop a means of incorporating virtual shelf research in Nfield.

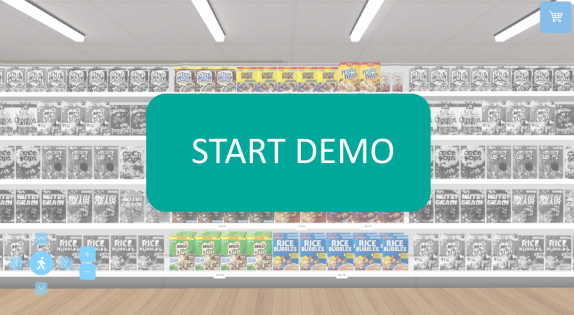
ConceptSauce can provide a virtual shelf or virtual store for market research, which enables shoppers’ actions to be monitored and timed. Virtual shelves can easily be adjusted to carry out A/B testing with altered prices, added promotional banners, changed packaging or different product positioning. You can also find out what happens when you send shoppers on a mission to find a particular product.
 DEMO
DEMO
Try the demo below to experience ConceptSauce’s virtual shelf.
When it comes to building your own shelves, ConceptSauce can do this for you, or you can do it yourself using their shelf builder.
Letting respondents loose on your virtual shelves is just the start.
Integrating Virtual Shelf in Nfield opens up a host of survey possibilities. Once the virtual shopping has been done, you can retrieve the lists of both the purchased items and the ones which were looked at but not chosen. Your Nfield questionnaire can ask why these decisions were made. In the case of sending shoppers to find specific products, you can see where they looked and how long it took.
The following high-level steps outline what needs to be done to integrate Virtual Shelf in Nfield. You can, of course, get your technical teams to explain!
Of course, you are very welcome to contact our helpdesk / salespeople for more information. Also, please feel free to share examples with us of how you’ve made this work.

In an online survey world that’s reliant on text responses, do you ever wonder how much you might be missing? Especially for questions which invite free-form answers. When you have respondents who struggle with typing, or articulating thoughts via written words, or for whom the survey is not in their first language.
To solve this, we need to think beyond text. We need to see what other possibilities are out there. We need to be inspired by behavioral changes, such as the increasing popularity of using WhatsApp for voice messaging instead of text messaging.
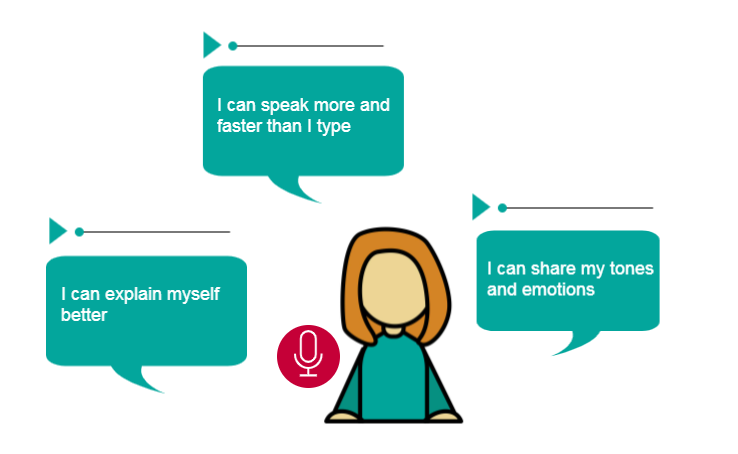
Voice messaging benefits both sender and recipient by allowing more information to be communicated, in less time, without the effort of pre-organizing thoughts. It also facilitates an extra layer of expression through tone-of-voice. And it’s a convenient solution for young and old alike.
Enabling audio answers in online surveys can therefore open up a whole new world of quality research, from a wider range of respondents. Respondents will share more information, including their emotions, and explain themselves better.
But how do you handle voice responses, to extract all the information they contain? Do you need extra resources, people and coding? Yes and no. There are already solutions which can intelligently transcript audio recordings into text and analyze tones-of-voice to identify emotions. However, humans will probably still be needed to ensure proper understanding of more in-depth messages.
To take your market research on respondents’ emotions to the next level, you can even consider video answers. Have you ever thought about how much information is revealed by a person’s facial expression?
According to research1 published in 2020, there are 16 universal facial expressions2. Imagine what you could learn about how a respondent instinctively feels, if you could capture their facial expression when they see an advertisement, poster, news story or new product.
Or what about their behavior when encountering new packaging design, how they use your hand soap or how they pour your drinks? Having these moments recorded can provide much more information than asking for conscious descriptions.

Worried about the overhead? You needn’t be. Professional emotion recognition software is able to analyze and interpret captured expressions.
To find out how to integrate audio and video recordings in Nfield Online surveys, see our post about to set this up this with Pipe. Also check out Phebi AI for voice emotion analysis.

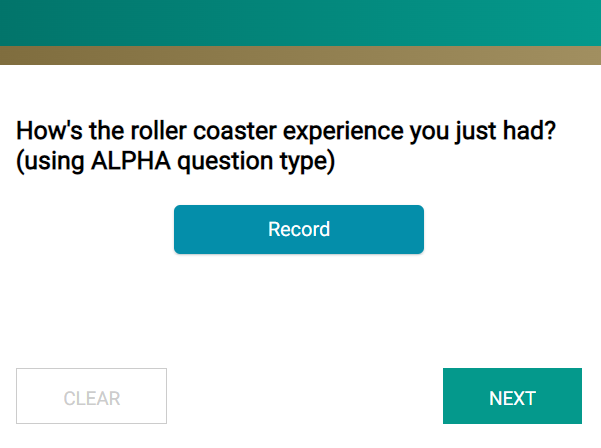
If you’d like to incorporate audio and video responses within Nfield surveys, you can do this by integrating Pipe’s recording platform. Below is an example of how this feature might be useful.
Incorporating Pipe into Nfield surveys requires specific technical expertise. You’ll need someone who is
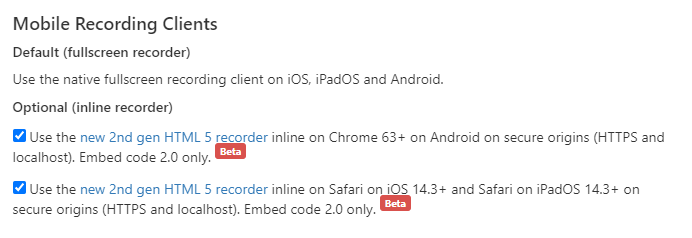
Gather your resources
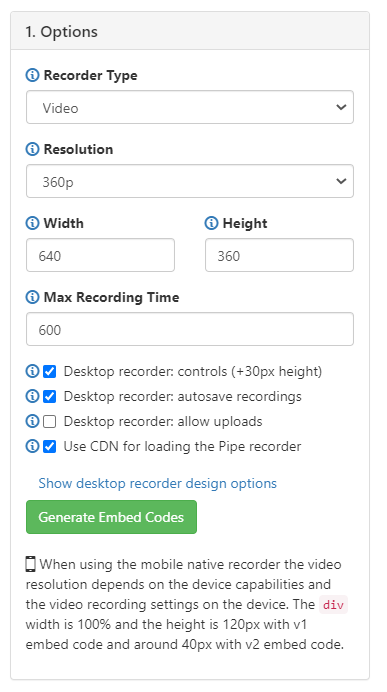
| Note: You should set the display size according to the device your respondents will use. It is also possible to make the sizing responsive to a range of device screens. Please refer to Pipe’s own instructions for this. |

Here is an example of ODIN script that will show an audio recorder and a video recorder. You can also download the script here. See beneath for explanations.
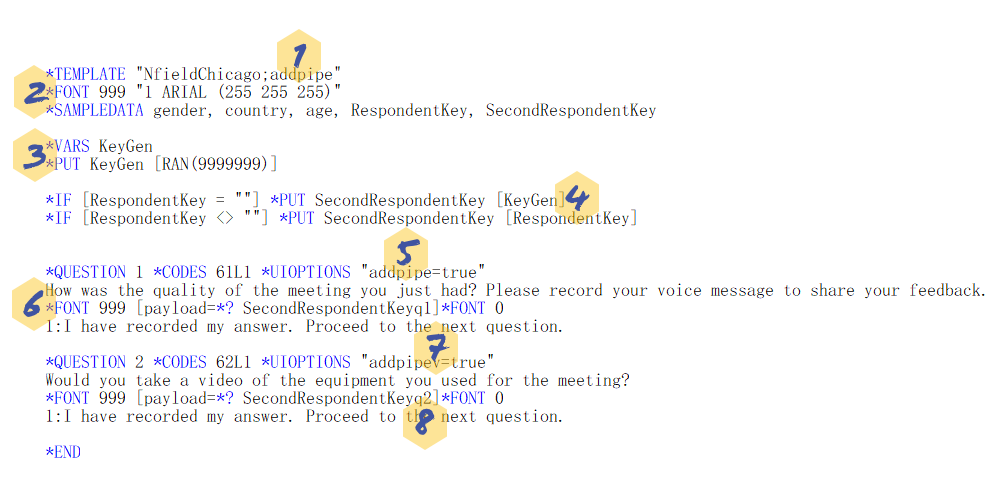
| Note: The higher the random number, the lower the chance of the duplicate SecondRespondentKey being made. You should therefore check this or decide which recordings to pick in the data processing part. |
| Note: Once each recording is uploaded to Pipe, you might want to add *BACK to prevent re-recording or do a check on re-recordings (spotted by same payload). |
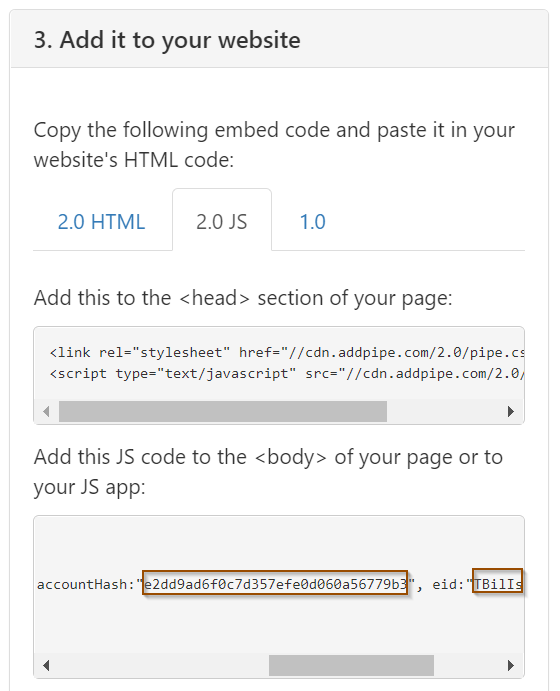
accountHash:" YourAccountHash", eid:"YourEID"YourAccountHash and YourEID with the JavaScript values previously generated in Pipe. (See step 5 in Setting up Pipe.)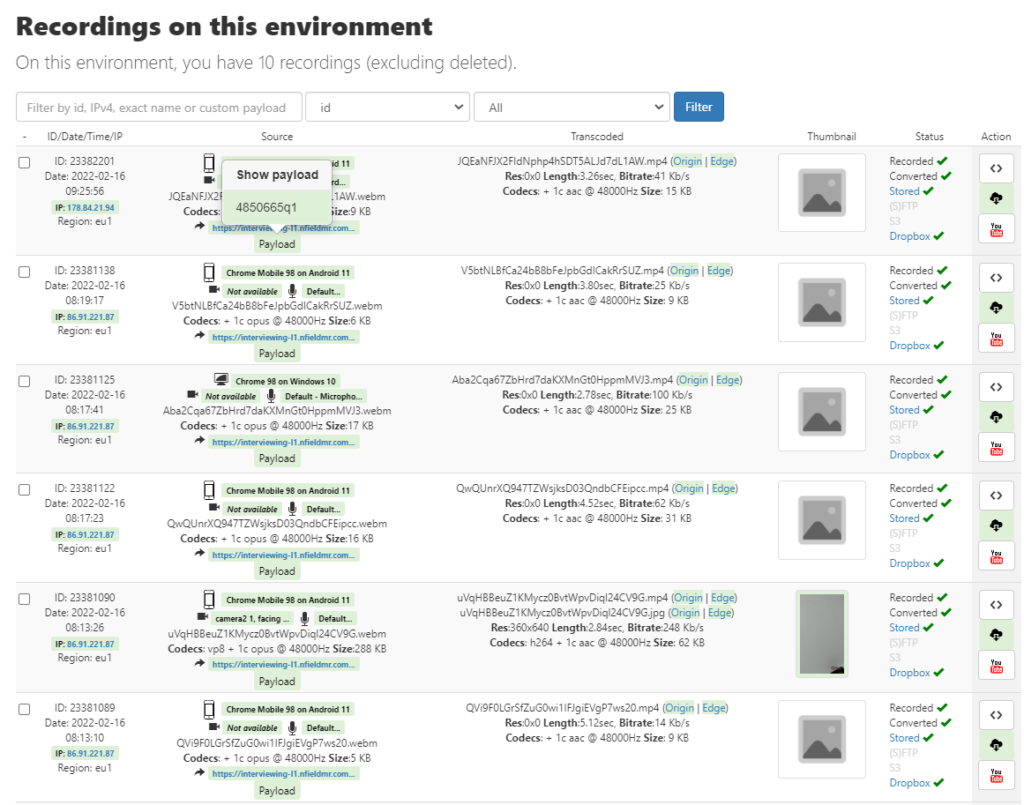
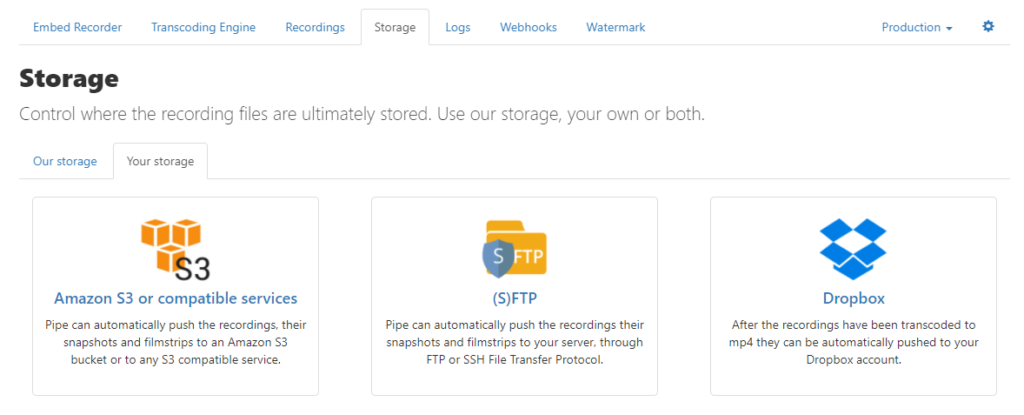
| Note: These recordings will be out of scope of Nfield. You should therefore be aware of the location where the data is stored, along with any different security and compliance levels. |
It would be too labor intensive to click every individual record to find the payload information (respondent key and question id) to rename its recording file. But you can automate this task by using a webhook to send the payload and file name to trigger file renaming (optimally in batches). Please refer to the Pipe Webhook documentation for how to use their webhook. Alternatively, you can program something yourself or use other codeless automation tools, such as Microsoft Power Automate, to do the work.
We hope you find these instructions useful. Please feel free to share your feedback with us.

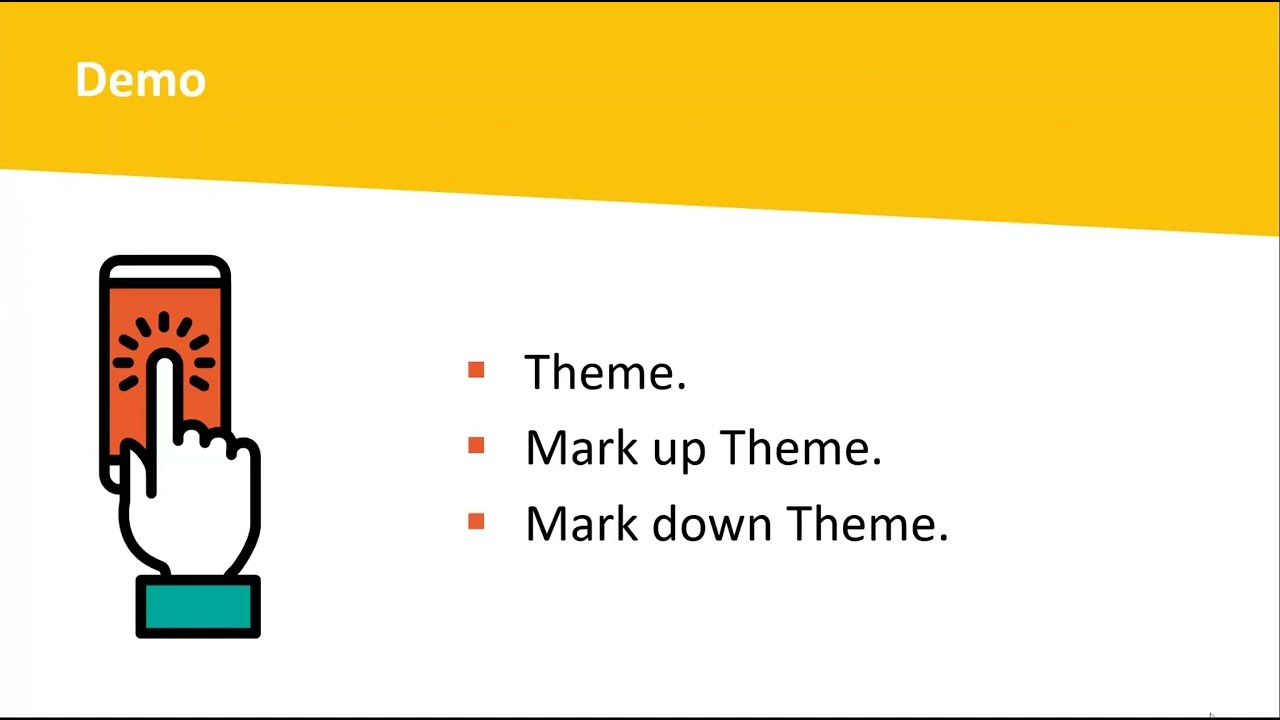
NIPO has released a Markdown theme to be used on top of the NfieldChicago template. With this theme you can use various Markdown language commands in your survey to highlight text, organize the survey page and style your survey. In this series of NIPO Academy sessions we will explain how to use this theme and demo some of the new options it provides.
Request a demo to see how NIPO can help you meet your requirements with our smart survey solutions.